


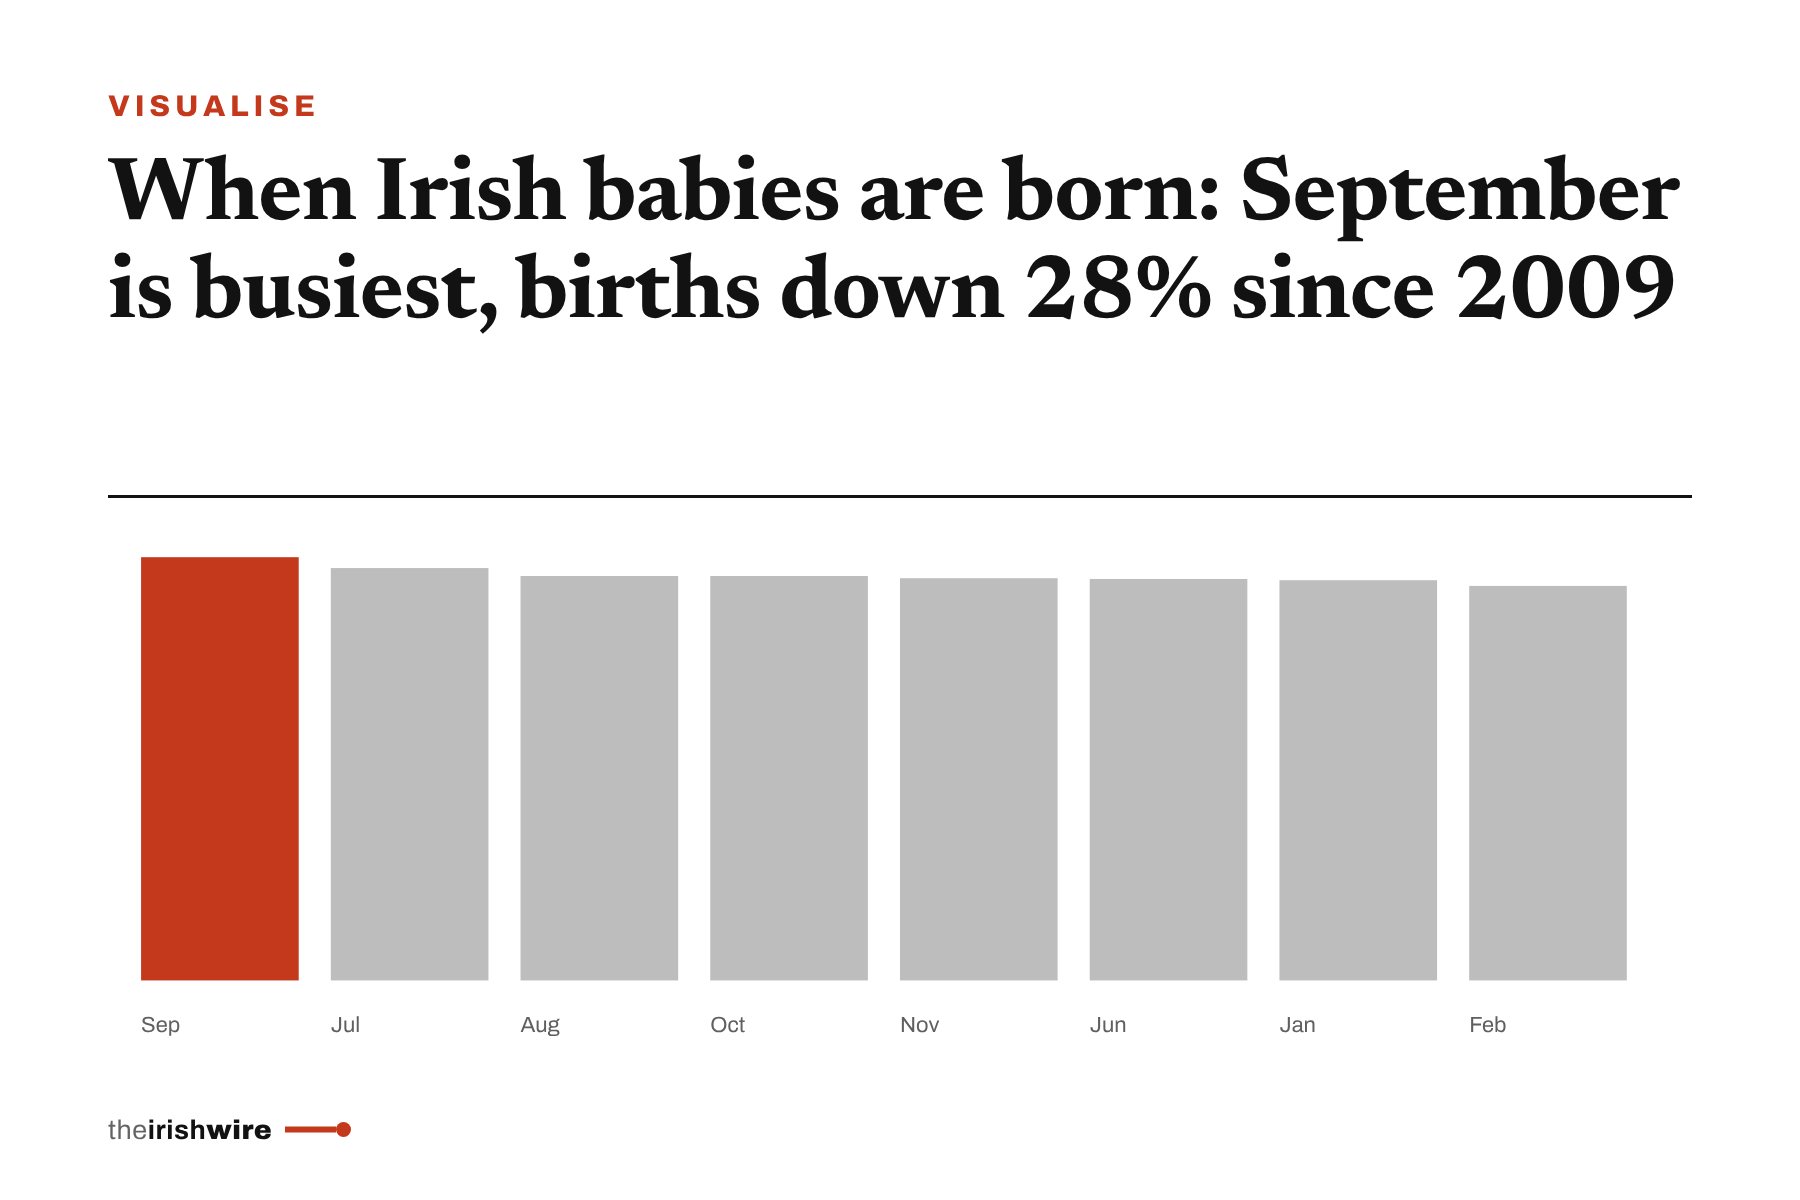
These charts show which months see the most births in Ireland, how many babies arrive each day, and how the yearly total has fallen since the 2009 peak.
September is the busiest time to be born
Ireland's maternity units are busiest in late summer and early autumn. Across the ten years from 2015 to 2024, September averaged 171 births a day. April was the quietest, at about 156 a day.
September was the top month for births per day in 12 of the 17 years from 2008 to 2024. July came top in three years. August and October came top once each.
The figures come from Eurostat, the EU statistics office. It publishes monthly births for Ireland based on data from the CSO, Ireland's Central Statistics Office.
The gap is not huge, but it is steady. On an average September day, about 10% more babies arrive than on an average April day. Group the months into quarters and the July to September quarter comes out on top.
- July to September: 26.0% of all births from 2015 to 2024
- October to December: 25.1%
- January to March: 24.4%
- April to June: 24.4%
- Total births counted over the ten years: 590,065
February has the fewest births, mostly because it is short
Count total births instead of births per day and February is nearly always last. It was the quietest month in 14 of the 17 years from 2008 to 2024. With only 28 or 29 days, it has fewer chances to catch up.
In 2024, the latest full year, October had the most births: 4,698. February had the fewest: 4,147. The gap between the busiest and quietest month was 551 babies.
February is the least popular month for babies.
February has the lowest total, but it is the shortest month. Counted per day, April was the quietest month from 2015 to 2024, and February came in the middle of the pack.
| Year | Busiest month (births) | Quietest month (births) |
|---|---|---|
| 2015 | July (5,968) | February (4,995) |
| 2016 | September (5,677) | February (4,951) |
| 2017 | August (5,384) | February (4,752) |
| 2018 | July (5,291) | February (4,562) |
| 2019 | August (5,274) | February (4,436) |
| 2020 | July (5,049) | November (4,348) |
| 2021 | September (5,352) | February (4,680) |
| 2022 | January (4,920) | April (4,204) |
| 2023 | October (4,811) | February (3,973) |
| 2024 | October (4,698) | February (4,147) |
Late 2020 and 2021 stand out
The months after the first COVID-19 lockdown show up clearly. November and December 2020 had some of the lowest totals of that decade, at 4,348 and 4,370 births.
Then births bounced back. September 2021 had 5,352 births, the highest monthly total since 2017. The CSO counted 60,575 births registered in 2021, up from 55,959 in 2020.
Ireland has about 21,000 fewer babies a year than in 2009
Births in Ireland peaked at 75,554 in 2009. By 2025 the CSO's provisional count was 54,125. That is a fall of 21,429 births a year, or 28%.
The fall has slowed. Each year from 2022 to 2025 had between about 54,000 and 54,500 births. The birth rate fell from 16.8 per 1,000 people in 2008 to 9.9 per 1,000 in 2025.
Put another way, Ireland had about 205 births a day in 2008. By 2024 that was down to about 145 a day, using Eurostat's monthly counts. That is roughly 60 fewer babies every day.
Kildare has the highest birth rate
Birth rates vary across the country. In 2025, Kildare had 12.0 births per 1,000 people, the highest of any council area, ahead of Louth (11.5) and Meath (11.3). Kerry had the lowest rate, at 8.2.
The CSO did not publish a 2025 birth rate for Cork, because of changes to the Cork City and County boundaries. Cork had 5,797 births registered in 2025. Dublin had 15,386, or 28% of the national total.
The fertility rate tells a similar story. This is the average number of children a woman would have over her life at current rates. The CSO says it was 1.5 in 2025, down from 1.9 in 2015.
Ireland's fertility rate in 2025, down from 1.9 in 2015
Source: cso.ieThe latest figures show a small rise
The newest CSO count covers January to March 2026. There were 13,823 births registered in that quarter, 158 more than in the same quarter of 2025.
Eurostat's monthly figures for the first half of 2025 also point slightly up. There were 26,157 births from January to June 2025, against 25,989 in the same months of 2024.
What the data does not show
The CSO publishes births by date and month in table VSA19, up to 2023. We found no CSO table of births by day of the week, so this page cannot say which weekday is busiest.
How to read these figures
- Monthly figures count when a baby was born. Yearly CSO figures count births registered, so they differ slightly.
- Births per day is an Irish Wire calculation. It divides each month's births by its number of days.
- The birth rate counts births per 1,000 people of all ages. Counties with older populations tend to have lower rates.
- The CSO figures for 2024 and 2025 are provisional and may change a little when made final.
- Eurostat monthly figures for Ireland run to June 2025 at the time of writing.
For the full tables, see the CSO's Vital Statistics Yearly Summary 2025, published on 2 June 2026.
CSO: Vital Statistics Second Quarter 2026. The Q2 2025 edition came out on 28 November 2025.
CSO: Vital Statistics Annual Report 2024, with final 2024 births. The 2023 report came out on 3 November 2025.
CSO: Vital Statistics Yearly Summary 2026, with provisional births for all of 2026
