


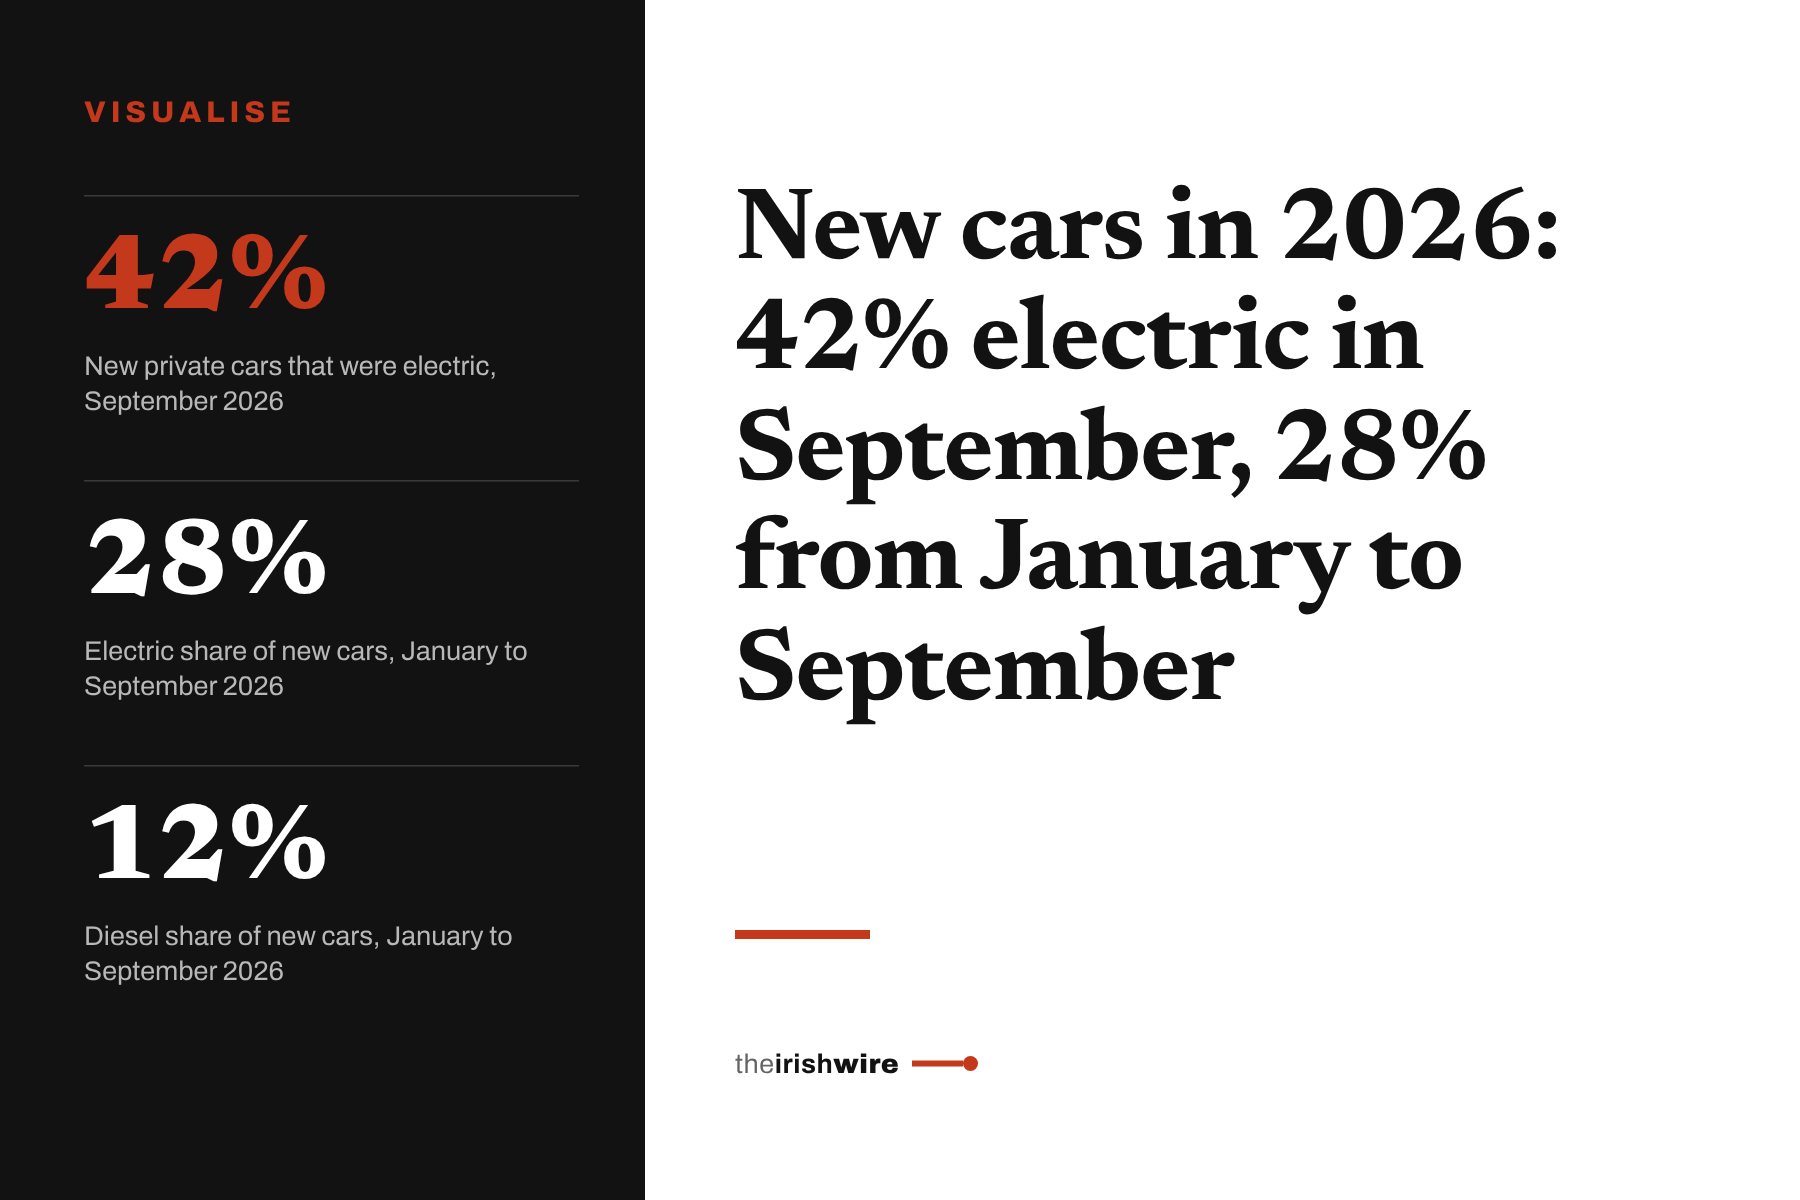
CSO figures show how the fuel mix of new cars has changed since 2015, how 2026 compares with 2025, and which counties have the most electric cars for their population.
In September 2026, more new cars were electric than petrol and diesel together
Of the 7,326 new private cars licensed in September 2026, 3,074 (42%) were fully electric. Petrol and diesel cars together came to 1,759, or 24%, according to the CSO. Electric also beat petrol and diesel combined in July and August 2026, but not across January to September as a whole (33,633 against 38,061).
A year earlier, in September 2025, the electric share was 29.7%. Ten years earlier, the picture was the reverse: in 2016, seven in ten new cars ran on diesel, and fewer than 400 of the 141,931 new cars were electric.
Hybrids and plug-in hybrids make up four in ten new cars
A hybrid has a petrol or diesel engine and a battery that the car charges itself. A plug-in hybrid (PHEV) has a bigger battery that can also be charged from a socket. From January to September 2026, hybrids made up 25% of new cars and plug-in hybrids 15%.
Across the first nine months of 2026, 119,709 new private cars were licensed, up 5% on 2025 and close to the 120,797 for all of 2025. Petrol was the single biggest fuel type in the first nine months of 2025, with 29,742 cars. In 2026, electric took that place, while petrol fell by 22% and diesel by 24%.
Month by month, the electric share kept climbing in 2026
The electric share of new cars rose almost every month of 2026. It was 22.4% in January, reached 30% in June and rose to 42.0% in September. Over the same months, the combined share of petrol and diesel fell from 31.2% to 24.0%.
Sales are uneven through the year. January 2026 was the busiest month, with 24,231 new cars, followed by July with 20,322. July also had the most new electric cars of any month, at 7,216.
Ordinary hybrids still outsell plug-in hybrids. From January to September 2026 there were 29,774 hybrids and 18,241 plug-in hybrids. Hybrids grew by 14% on 2025, and plug-ins by 6%.
Electric car numbers have risen almost tenfold since 2019
Growth has not been smooth. New electric cars fell from 22,493 in 2023 to 17,191 in 2024, before rising to 23,398 in 2025. The first nine months of 2026 have already passed that by more than 10,000.
Imported used cars matter too. They made up 37% of all cars licensed for the first time from January to September 2026. Of those 70,207 imports, 11% were electric, up from 5% a year earlier.
Imported cars are also getting older. From January to September 2026, 29% of used imports were more than 10 years old, up from 14% in 2022. Only 1% were under a year old.
- Most popular new electric models in September 2026, by the CSO count:
- Tesla Model 3: 454
- Tesla Model Y: 282
- MG MG4: 214
- Volkswagen ID.4: 186
- Hyundai Inster: 131
Wicklow and Kildare lead for electric cars per person
The map below is not about 2026 sales. It shows all private electric cars licensed in June 2026, from the CSO count of the whole fleet. Wicklow had 37.8 licensed electric private cars per 1,000 people, the highest of any county.
| County | Electric cars | Population (2022) | Per 1,000 people |
|---|---|---|---|
| Wicklow | 5,884 | 155,485 | 37.8 |
| Kildare | 8,789 | 246,977 | 35.6 |
| Dublin | 47,401 | 1,450,701 | 32.7 |
| Meath | 6,647 | 220,296 | 30.2 |
| Cork | 13,840 | 581,231 | 23.8 |
| Longford | 550 | 46,634 | 11.8 |
| Mayo | 1,618 | 137,231 | 11.8 |
| Donegal | 1,884 | 166,321 | 11.3 |
| Monaghan | 704 | 64,832 | 10.9 |
| Ireland | 124,753 | 5,123,536 | 24.3 |
In raw numbers, Dublin had by far the most electric private cars, 47,401, followed by Cork (13,840) and Kildare (8,789). Leitrim had the fewest, 434. Monaghan, Donegal, Mayo and Longford had fewer than 12 per 1,000 people, about a third of the Wicklow rate.
Share of all licensed vehicles that were fully electric in June 2026
Source: cso.ieSo most cars on Irish roads still run on petrol or diesel. In June 2026, 85.3% of all 3,340,922 licensed vehicles did. Electric cars are newer: 81.1% of private electric cars were less than five years old.
Ireland is ahead of the EU average, though. In 2024, electric cars were 3.1% of Ireland's passenger car fleet, against 2.2% across the 27 EU countries, the CSO reports.
How to read these numbers
- "Licensed for the first time" means a car taxed in Ireland for the first time, whether new or imported second-hand.
- Electric means a fully battery electric car. Hybrids and plug-in hybrids still have a petrol or diesel engine.
- The county map shows all licensed electric cars in June 2026, not just new ones bought in 2026.
- Per 1,000 people uses the Census 2022 population in the CSO fleet table, so fast-growing counties may look a little higher than they are.
- Electric car figures here count only fully electric cars licensed in Ireland. They do not include vans, buses or motorbikes.
Most new cars in Ireland are still diesel.
Diesel was 12% of new private cars from January to September 2026, down from 71% in 2015. Electric cars (28%) and hybrids (25%) each outsold diesel.
CSO Vehicles Licensed for the First Time October 2026 (the September edition came out on 9 October 2026)
CSO Vehicles Licensed for the First Time December 2026, with full-year 2026 totals by fuel type
CSO Composition of Ireland's Vehicle Fleet 2027, with updated county figures (the 2026 edition came out on 28 July 2026)
- CSO: Vehicles Licensed for the First Time September 2026
- CSO: Vehicles Licensed for the First Time, monthly releases January to August 2026
- CSO PxStat: TEA27, New and secondhand vehicles by taxation class and fuel type, 2010 to 2025
- CSO PxStat: TEM12, New vehicles licensed for the first time by month and fuel type
- CSO: Composition of Ireland's Vehicle Fleet 2026, Key Findings
- CSO: Press Statement, Snapshot of Transport Statistics in Ireland June 2026
